

- Product
- Solutions
Open source
Pro
- Platform Features
- DEVELOP
Components
Plugins
- DEPLOY
CI/CD
- MONITOR
Metrics
Alerts
Troubleshooting
- SECURE
Policies
Dashboard
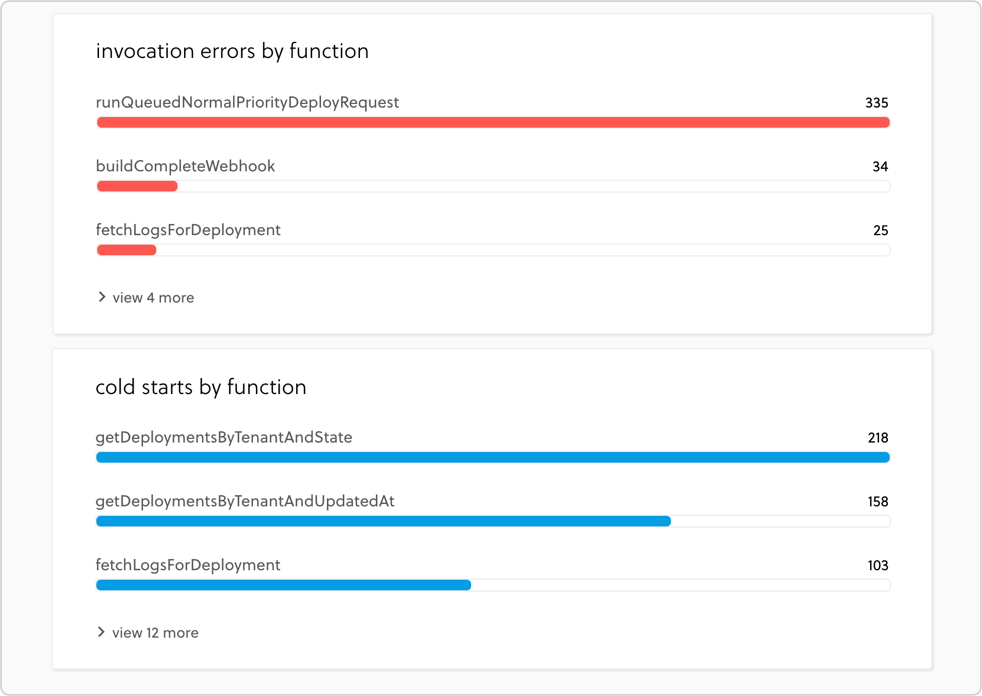
Monitoring made easy
Open your Serverless Framework dashboard and gain instant awareness of your service’s health - from errors, cold starts and timeouts, to invocations and request patterns. Glance at the latest alerts or dive in deeper into function spans, stack traces and logs.
With Serverless Framework, there is no need to spend time instrumenting your code in order to monitor your application. On deployment, Serverless Framework automatically instruments your services.

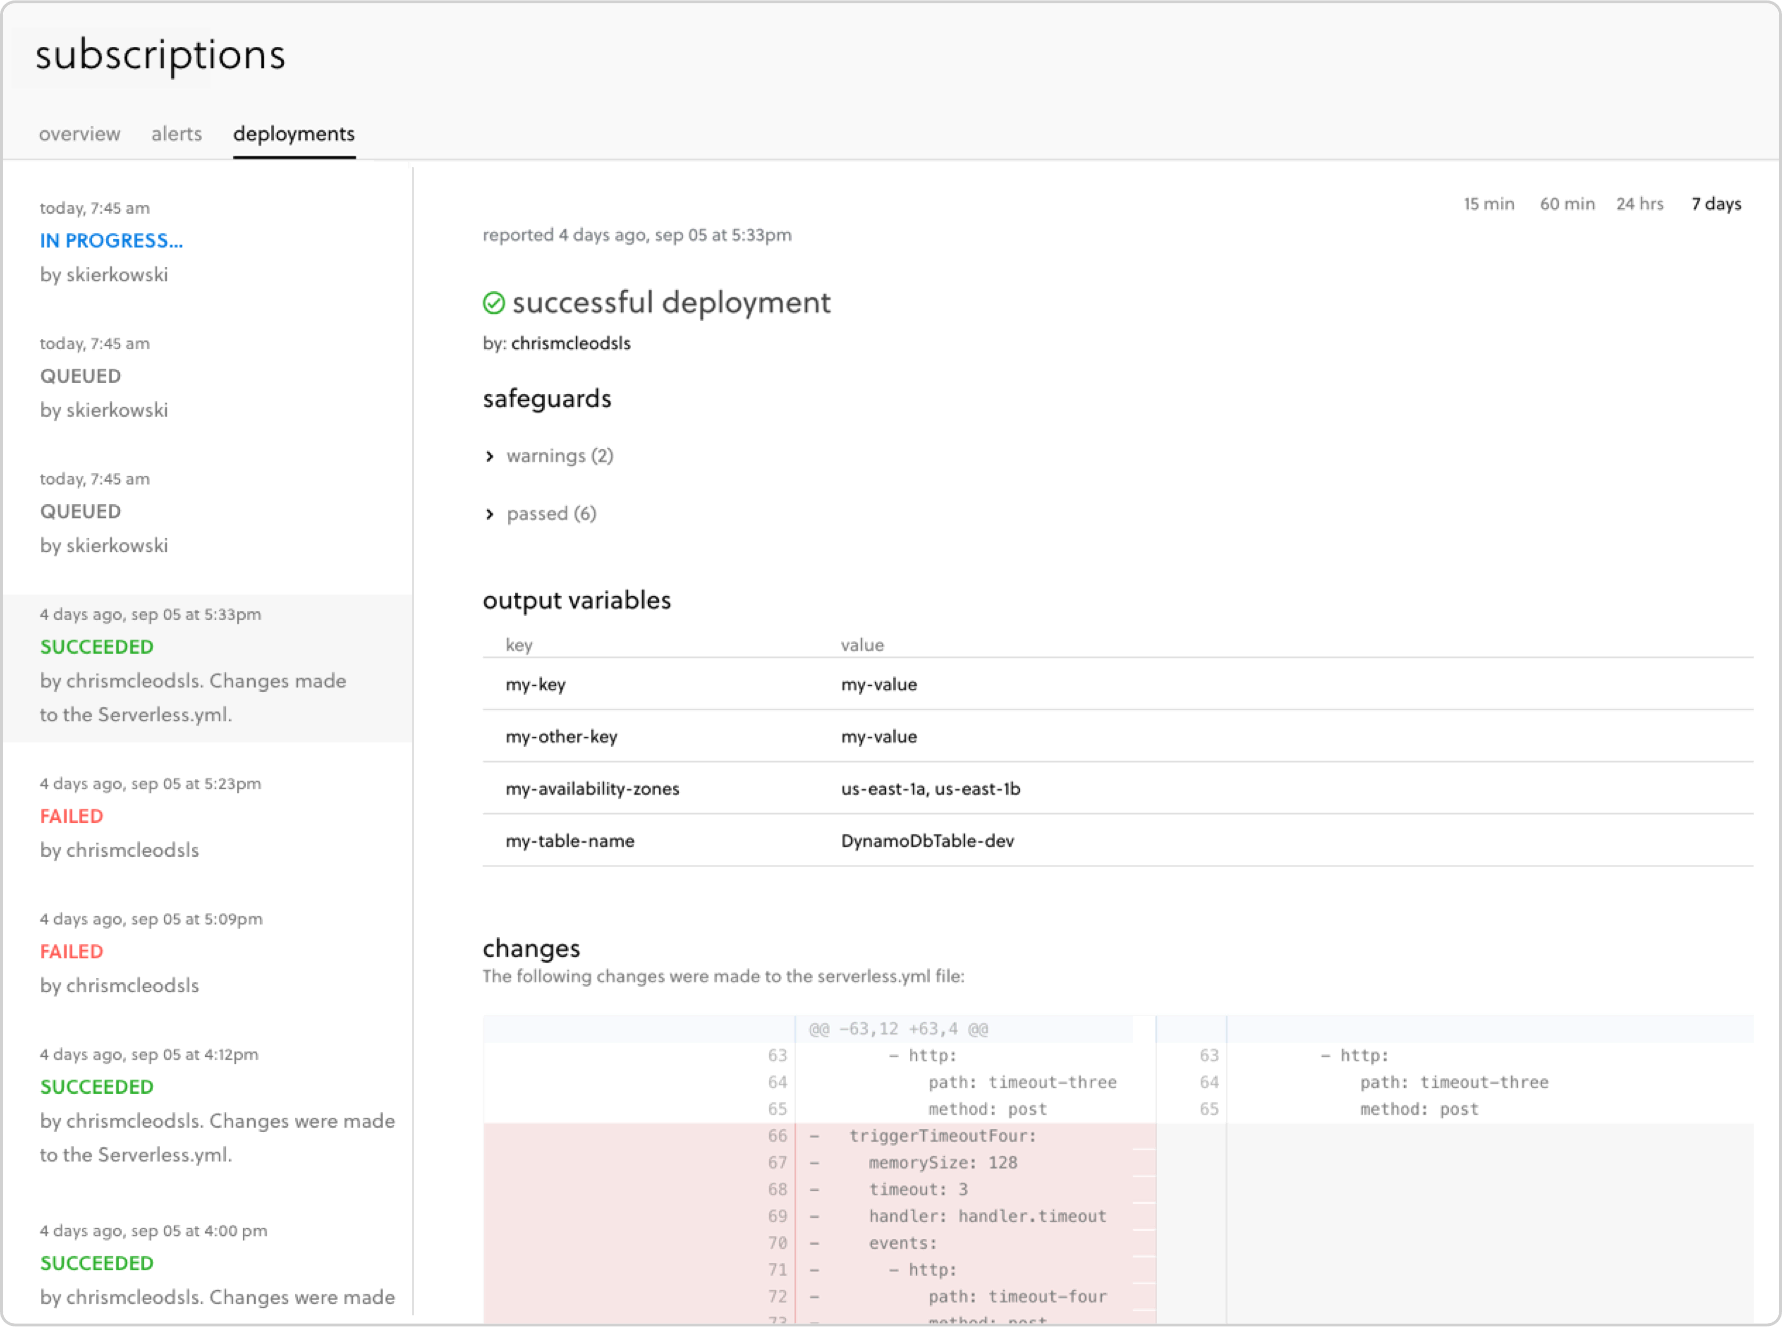
Deploy with confidence
With our deployment tracker, you’ll learn right away when changes you make to your service affect performance or cause an error. Scan the deployments stream and open a deployment report to view VCS information, policy compliance status, output variables, deployment logs and code diffs.
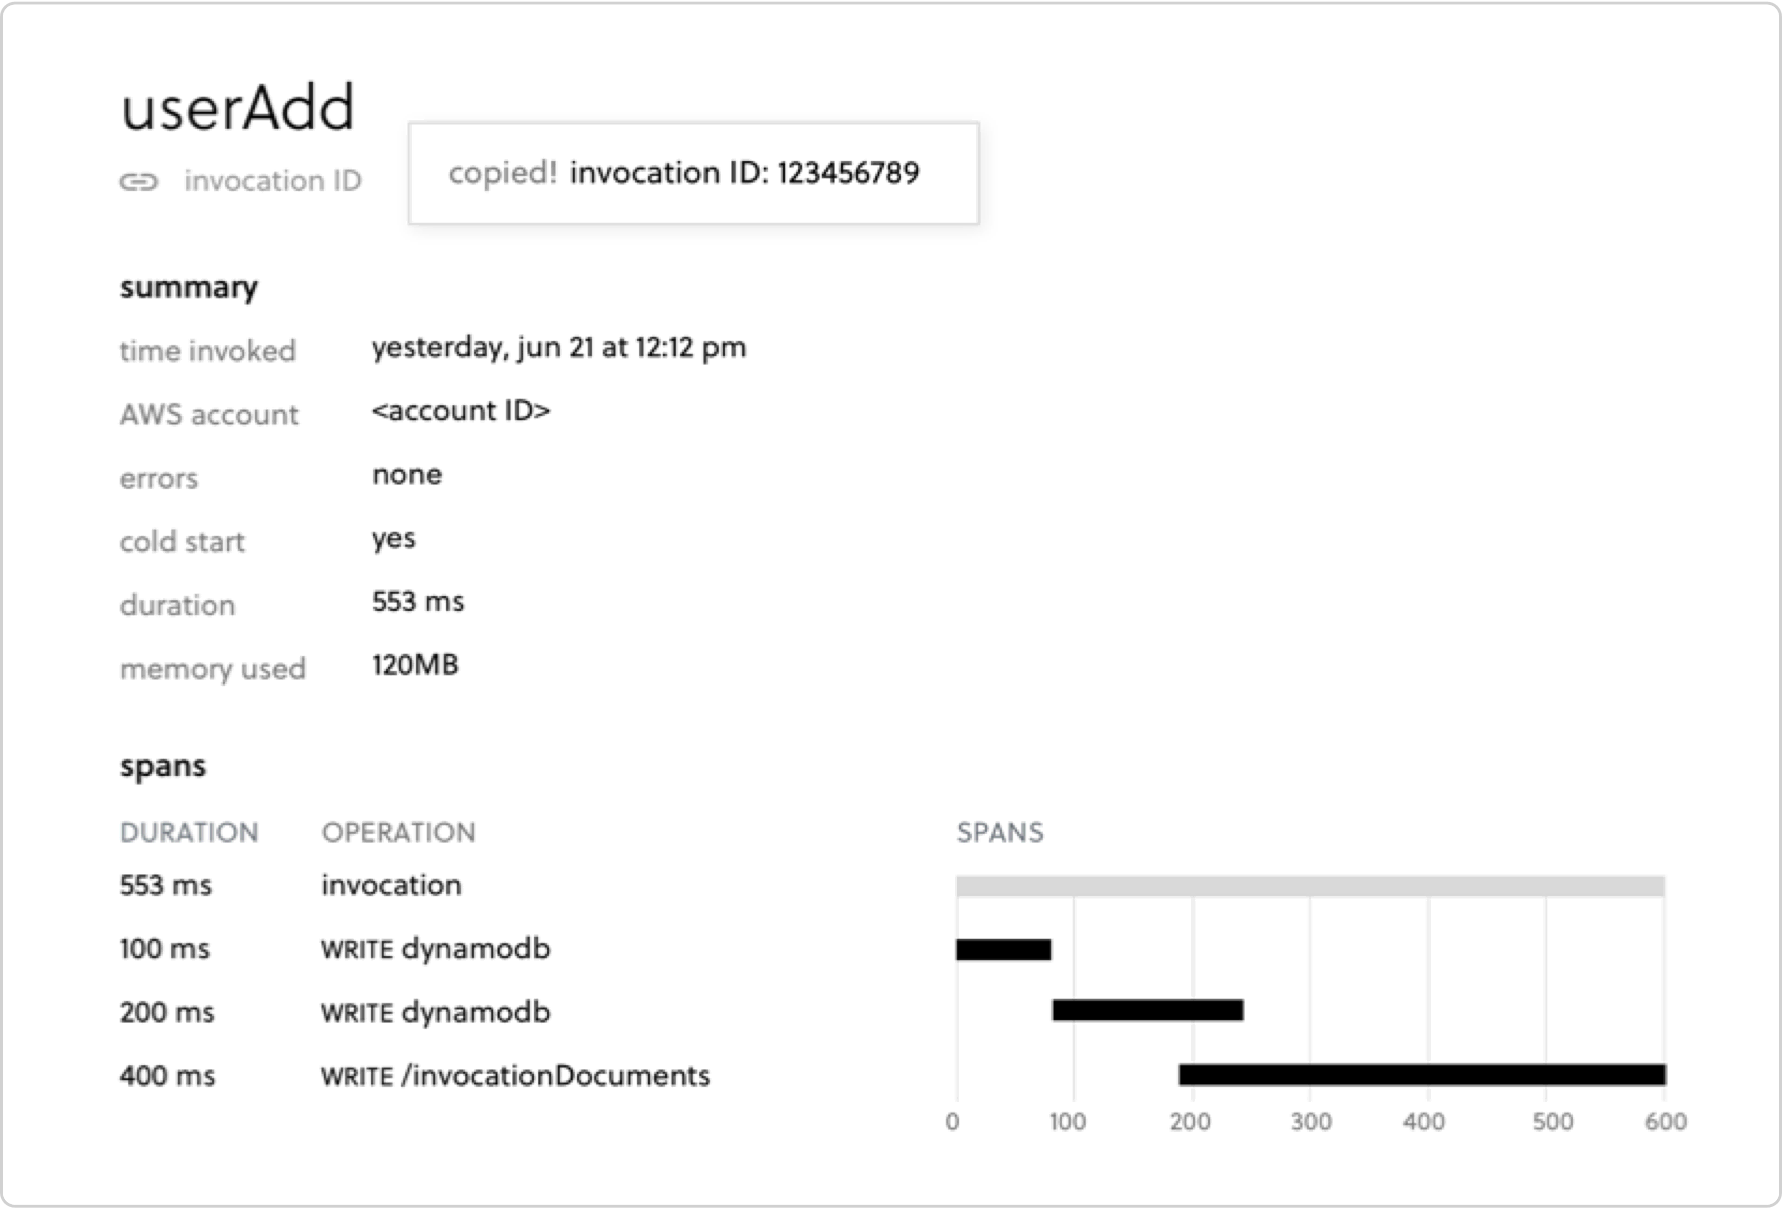
All Signal, No Noise
The Serverless Framework Monitoring’s smart alerts and graphs take you straight to the exact log section, function span and stack trace you need to help you resolve issues. Because we instrument your services for you, we can provide guided paths from awareness to resolution, so you don’t have to spend time looking for correlations yourself.
Product