

- Product
- Solutions
Open source
Pro
- Platform Features
- DEVELOP
Components
Plugins
- DEPLOY
CI/CD
- MONITOR
Metrics
Alerts
Troubleshooting
- SECURE
Policies
Dashboard
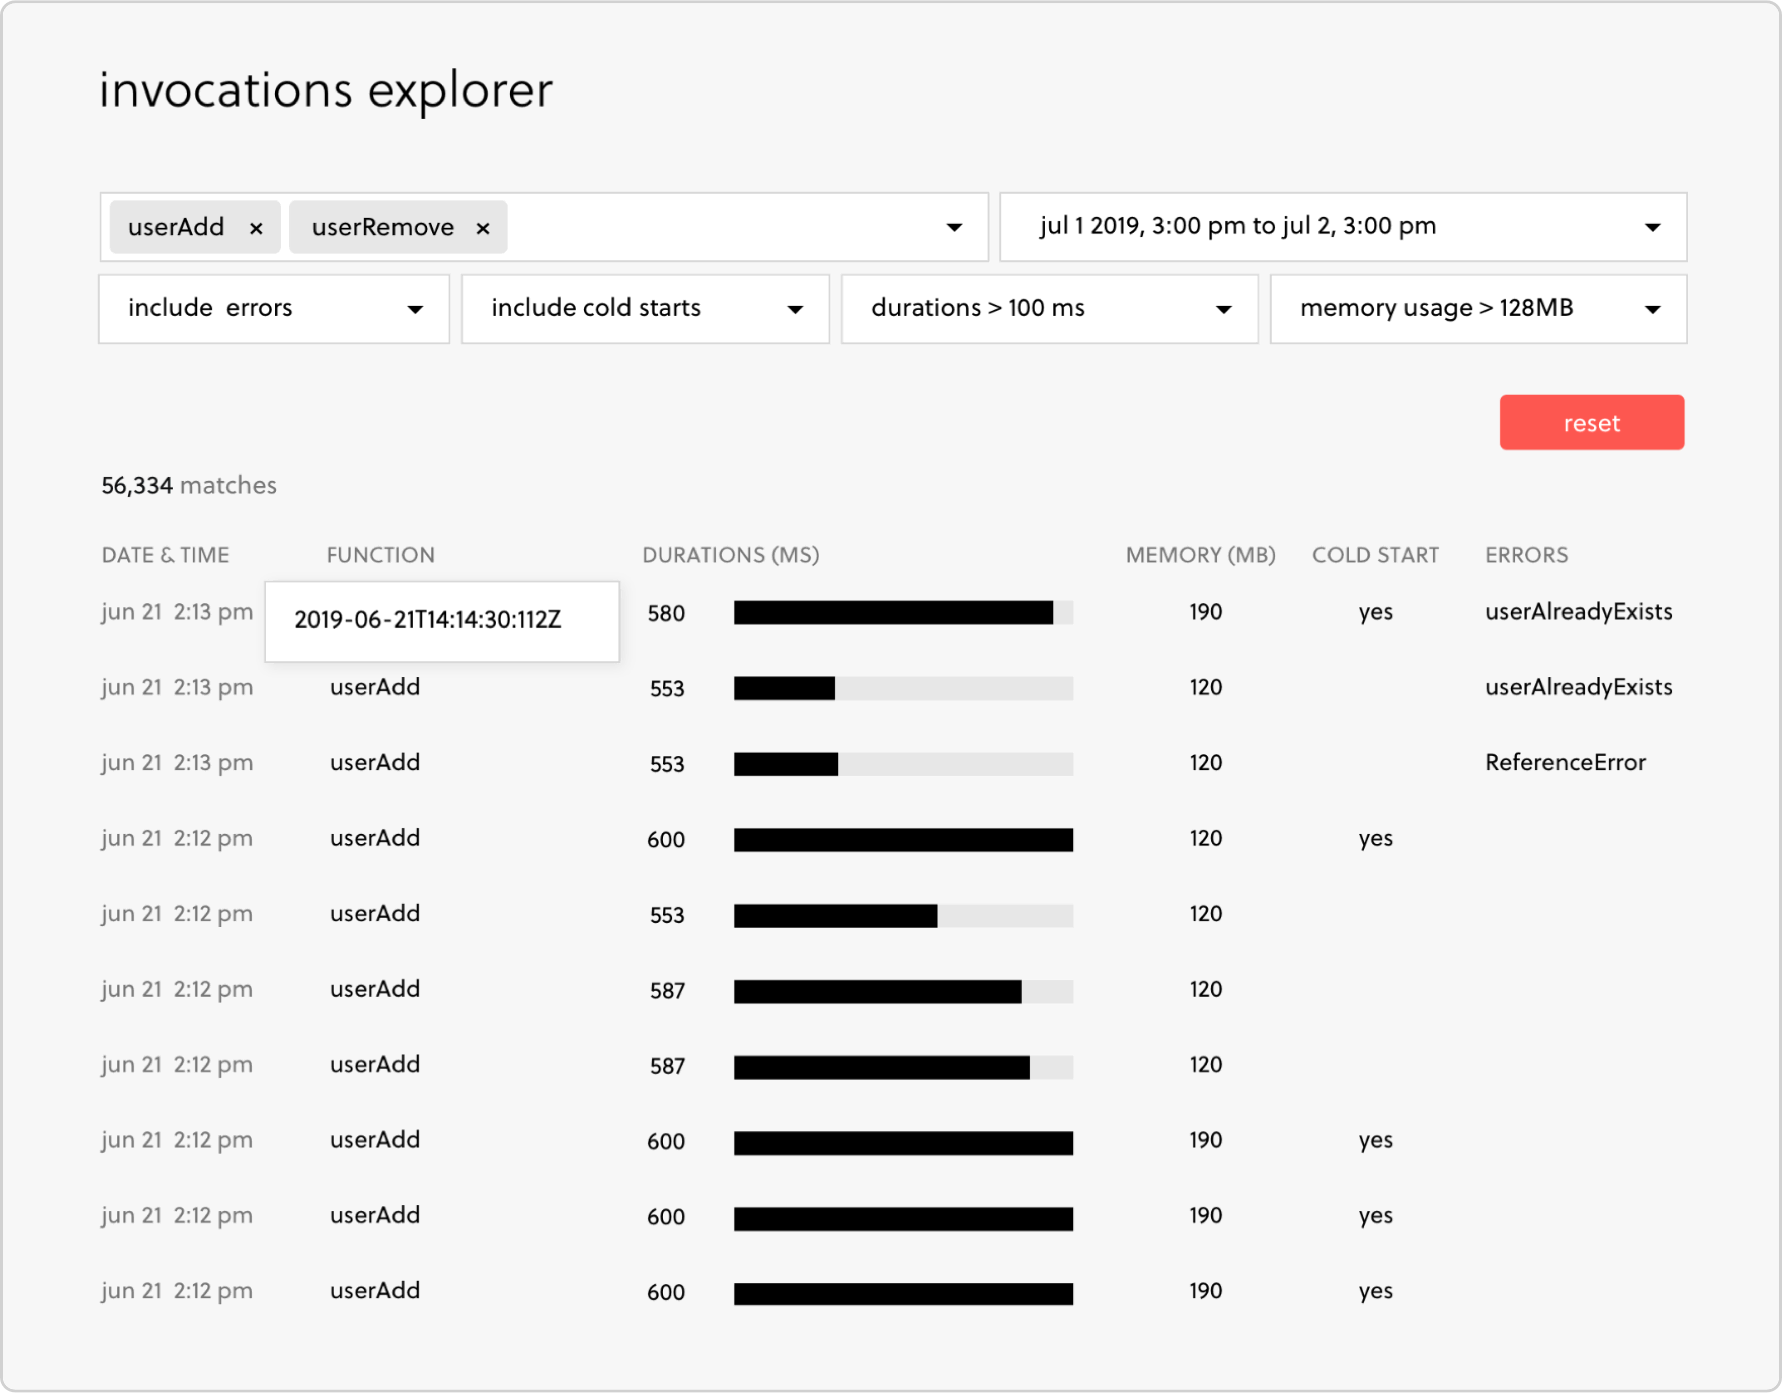
Debug faster with the Invocations Explorer
Quickly troubleshoot and optimize the performance of your functions with the Invocations Explorer.
Scan for anomalies in memory usage, durations, cold starts and errors. Click an invocation to view all the information you need to help you resolve an issue quickly.
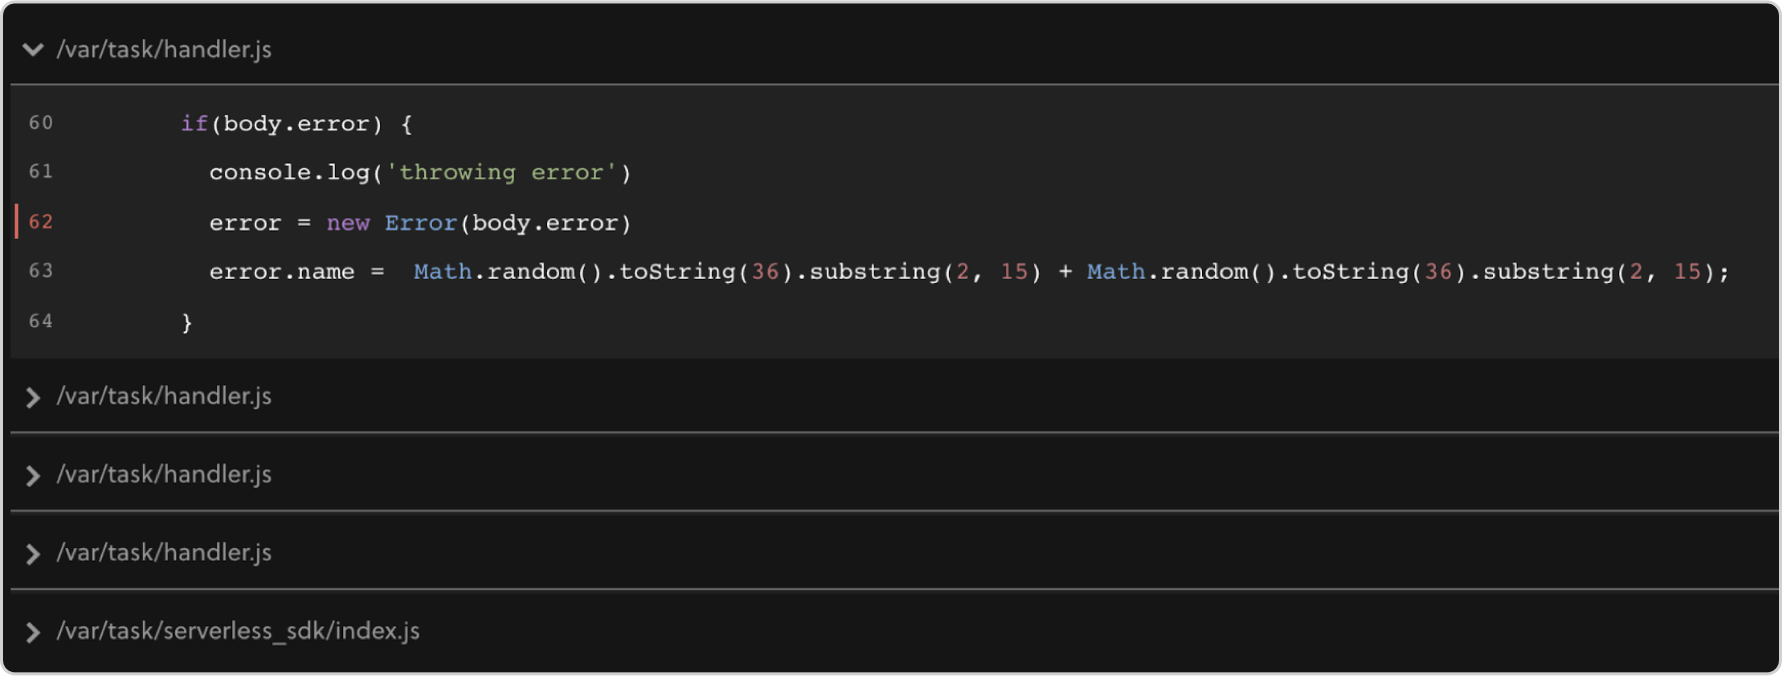
Go straight to the code
Along with the Invocations explorer, use our most popular tool for debugging code: the stack trace. It takes you straight to the line of code which caused the error.
No more pouring through Cloud Watch logs
Invocation details also include the relevant debugging sections from your Cloud Watch logs, so you see only the log data you need.
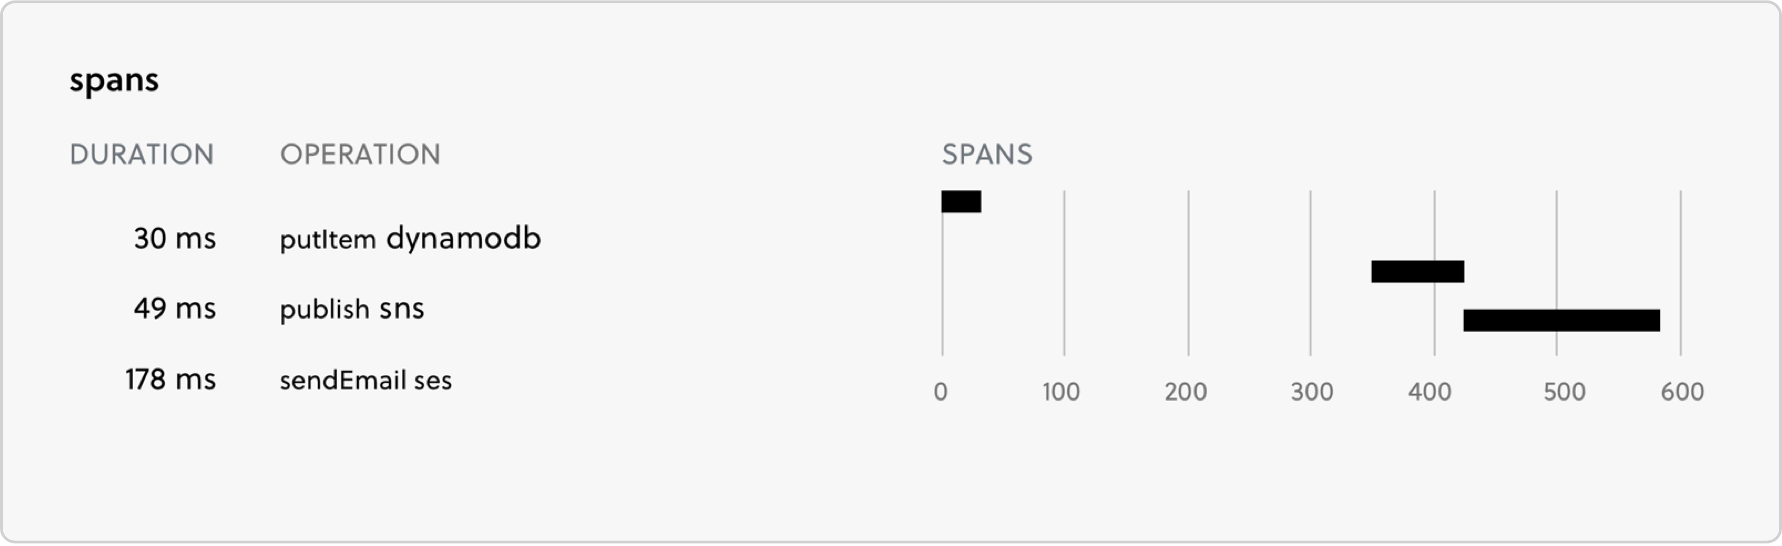
Additionally, every call to AWS services like S3, DynamoDB, SES, and more, is automatically instrumented and visualized, so you can see when the call was made and how much time your function spent waiting for a response.
Product