


We admit it. In the serverless realm, getting the observability you need can be really frustrating.
In his series on serverless observability, Yan Cui has stated the challenges, and the reasons behind them, incredibly well.
But there is hope.
There is a constant onslaught of new tools, new features, and loud voices demanding change. At this point, we’re truly at the cusp of serverless observability being not just passable, but great.
In this post, we are compiling resources that you can use to have top notch insight into your functions. We will update this as new information becomes available, so it can serve as an observability tools guide for you, the intrepid serverless developer.
Read on for the best tools and best practices.
The tools
AWS CloudWatch
CloudWatch is the native AWS logging tool. It’s primarily for logging, monitoring, and alerts.
Benefits:
- Tracing & profiling to investigate performance and cold starts
- Monitoring and error logs
- Customizable alerts
- For Lambda users, works out of the box
- A lot of people use it, which means there are a lot of plugins and other resources widely available
Drawbacks:
- Metrics have up to one minute delay (not real-time)
- No customizable events
- Will probably need to use a separate log aggregator for centralized logging
Metrics: Cloudwatch comes with easy Lambda metrics; no setup.
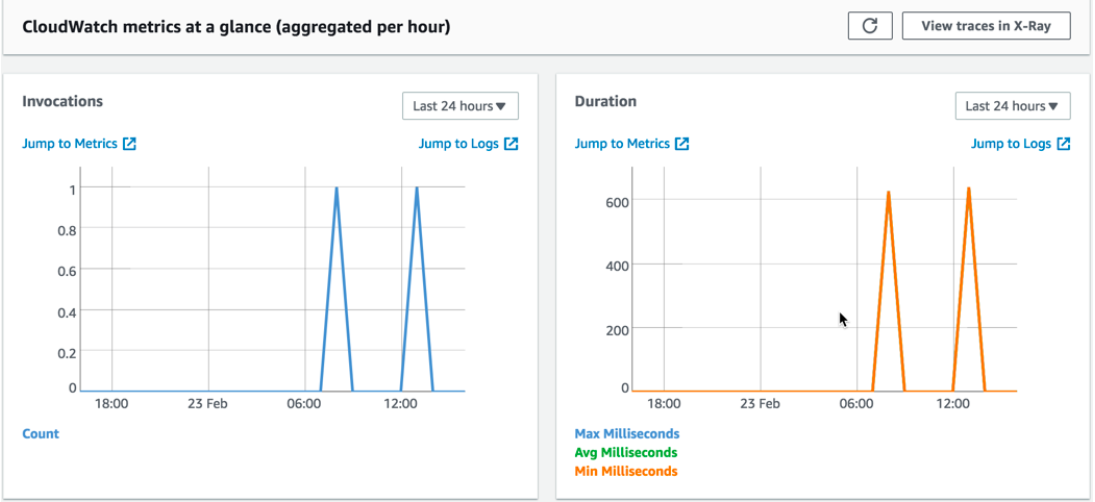
Logs: Logs from your Lambda function, plus general status logs, are sent directly to Cloudwatch Logs.

Further reading:
AWS X-ray
X-ray is a distributed tracing system you can use for debugging across various AWS systems. It’s usage is not mutually exclusive with another tool, like IOpipe or CloudWatch, and most people use X-ray in conjunction with another monitoring tool.

Further reading:
Dashbird
Ever used the native CloudWatch interface? Not always touted as the most user-friendly UI. Dashbird sits on top of CloudWatch and provides a more navigable user experience, plus a few additional features.
Benefits:
- Tracing & profiling to investigate performance and cold starts
- Monitoring and error logs for debugging your serverless functions
- Doesn’t require additional code to implement
- Customizable alerts
- Lambda cost-analysis (per-function basis)
Drawbacks:
- Metrics have up to one minute delay (not real-time)
Performance metrics: includes extras like Lambda cost analysis.

Architecture metrics: track account-level stats across your entire architecture (individual microservice views also available).

Further reading:
IOpipe
IOpipe works with AWS Lambda functions written in Node.js, Python, and Java. It provides tracing, profiling, monitoring, alerts, and real-time metrics.
Benefits:
- Tracing & profiling to investigate performance and cold starts
- Monitoring & customizable events for granular error logs and debugging your serverless functions
- Real-time metrics
- Customizable alerts
- Really easy to install and get running
Drawbacks:
- You have to use a wrapper for each function, which can result in performance delays (about 20ms)
Real-time metrics: Monitor invocations, duration, memory usage, and errors in one place.

Search functionality: You can add multiple “rules” to find invocations that match. The example below looks for long-running invocations over 100ms, but you can search for errors, cold starts, or even custom metric values (e.g., “userId” = 1234).

Further reading:
Thundra
Thundra has not yet hit general availability, but you can sign up for beta access here.
Much like IOpipe, it promises to provide tracing, profiling, monitoring, alerts, and metrics.
Thunda will differ from IOpipe in a couple ways. They plan to focus on Java rather than Node.js or Python. They are also attempting to avoid latency by keeping data-sending separate from the Lambda function itself. Instead, they’ll first write their metrics to logs, and an out-of-band log processor will send those metrics to the Thundra backend.
Further reading:
OpenTracing
OpenTracing, is a vendor-neutral open standard for distributed tracing that is supported by the CNCF. Libraries are available in 9 languages: Go, JavaScript, Java, Python, Ruby, PHP, Objective-C, C++, and C#.
Note that this is a standard, and not a tool. You’ll have to set up your own collector and interface, or you can use a paid tool such as LightStep.
Benefits:
- You can use it with any cloud provider, not just AWS
Drawbacks:
- Takes some set-up
Further Reading:
- Supported Tracer Implementations
- Distributed Tracing in 10 Minutes
- Towards Turnkey Distributed Tracing
- OpenTracing: An Open Standard for Distributed Tracing
Epsagon
Epsagon is a serverless monitoring and observability tool that automatically detects full transactions throughout a company’s system, calculates costs and provides aggregated numbers around cost and performance across the most critical business functions. Using distributed tracing and AI technologies, Epsagon helps companies significantly reduce downtime and cost by providing end-to-end observability and application performance monitoring at the application level.
Troubleshooting using distributed tracing: automatic instrumentation provides full traces.

Application performance and cost monitoring: complete dashboard for the health of the serverless application.

Benefits:
- Automatic tracing and monitoring of the entire application, including distributed tracing.
- AI-based prediction and alerting of issues before they happen.
Drawbacks:
- Automatic instrumentation adds a few milliseconds to the running time of the code.
Further Reading:
- Epsagon emerges from stealth
- Epsagon Launch - Why We Started Epsagon
- 5 Ways to Gain Serverless Observability
Did we miss anything?
Feel free to leave comments, and/or submit a PR against this post to leave us suggestions.

About Andrea Passwater
Andrea leads growth marketing at Serverless.
Product